Spatial Computing Lab

Welcome to the Spatial Computing Laboratory at IIIT Bangalore.

ABOUT US

We research the technologies in the field of Spatial Computing.

“The Spatial Computing Laboratory at IIIT Bangalore aims to study general and specific topics in spatial computing, spatial data science/data mining, spatial databases, geo-statistical techniques and time-series forecasting models. The common thread in our research is to apply Advancements in Geospatial Technologies, Data Science, Artificial Intelligence and Statistical Methods to research problems at the interface of Computer Science and Spatio-Temporal Data of the Earth Observing Systems.”

The Lab is driven by some of the dedicated and smart researchers contributing new spatial data science capabilities to computing ideas and technologies in interdisciplinary areas of Geographic Information System (GIS) and Remote Sensing, Geoinformatics, Applied Machine Learning, Time Series Data Analysis, Big Data Analytics, Geo- (Artificial & Location) Intelligence, Geo-Smart solutions in Digital Agriculture, Urban Informatics, and Geo-spatial Applications in Natural Resource Management, Climate Studies, etc. Our Lab Members have won several Best Paper Awards, received Recognition, and achieved competitive International Travel Grants.

                             NEWS/UPDATES


Feb 2024

Paper titled “Advancing Image Classification through Parameter-Efficient Fine-Tuning: A Study on LoRA with Plant Disease Detection Datasets” accepted at ICLR 2024.

Jan 2024

Congratulations. Yash Mittal successfully defended his Master of Science (MS) by Research Thesis on “Incremental Learning on Spatial Data and Applications”.

Dec 2023

Paper titled “Prediction of Transportation Index for Urban Patterns in Small and Medium-sized Indian Cities using Hybrid RidgeGAN Model” accepted in Nature Scientific Reports.

Background: The last few decades have witnessed a massive increase in Big Geodata from space-borne and airborne sensors. The goal is to provide large-scale, homogeneous information processing from these ever increasing multi-modal data sources that require automated and intelligent frameworks for storage and analysis. The resurgence of machine learning and deep neural networks have revolutionised computational methods and have found wide applications in the land cover and land use classification, content-based information retrieval, region of interest detection and temporal analysis of continuously evolving remote sensing data. Due to the availability of data from many satellite missions in public domain, certain multi-modal approaches such as multi-sensor data fusion or pan-sharpening and cross-modal information retrieval are of extreme importance. Earth observation tasks also entail the necessity for various location-based services, online mapping services, surveillance, crop-monitoring, soil-moisture tracking, change detection applications, etc. Our specific topics of research interests in Computational Intelligence in Remote Sensing Data/Image Analysis include:

      • Machine learning and Deep learning in Geospatial Science

      • Image understanding and synthesis

      • Image classification using Supervised and Unsupervised learning/Clustering

      • Time-series forecasting models

      • Spatio-temporal models

      • Urban growth modelling

      • Urban climate

      • Digital agriculture

      • SAR data analysis

      • UAV data analysis

      • Multi-modal Data Fusion

      • Target detection and Segmentation

      • Spectral and Spatial methods

      • Spectral unmixing

      • Noise recognition and filtering

      • Change detection

Please see below our recent research snippets.
(Click to enlarge)
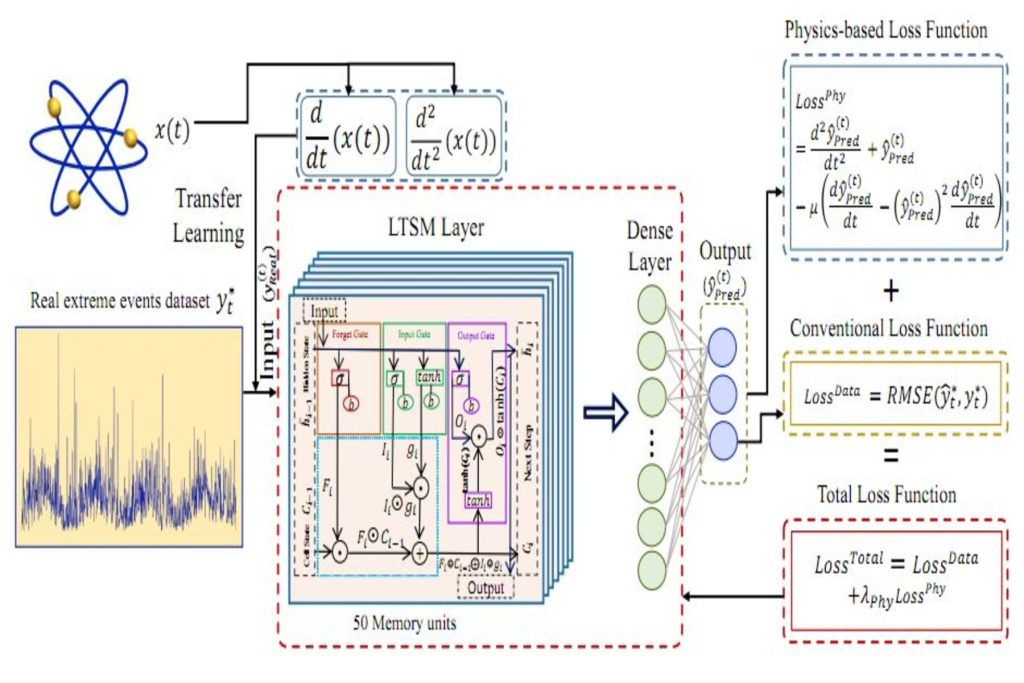
Van der Pol-informed neural networks (VPINN). Simulated data were generated from Van der Pol oscillator and it's time derivative was concatenated to the real target series. These were modelled using LSTM and a dense layer for predictions. A modified loss function, combining the conventional loss and the physics-based loss, was used to train the network with a backpropagation approach.
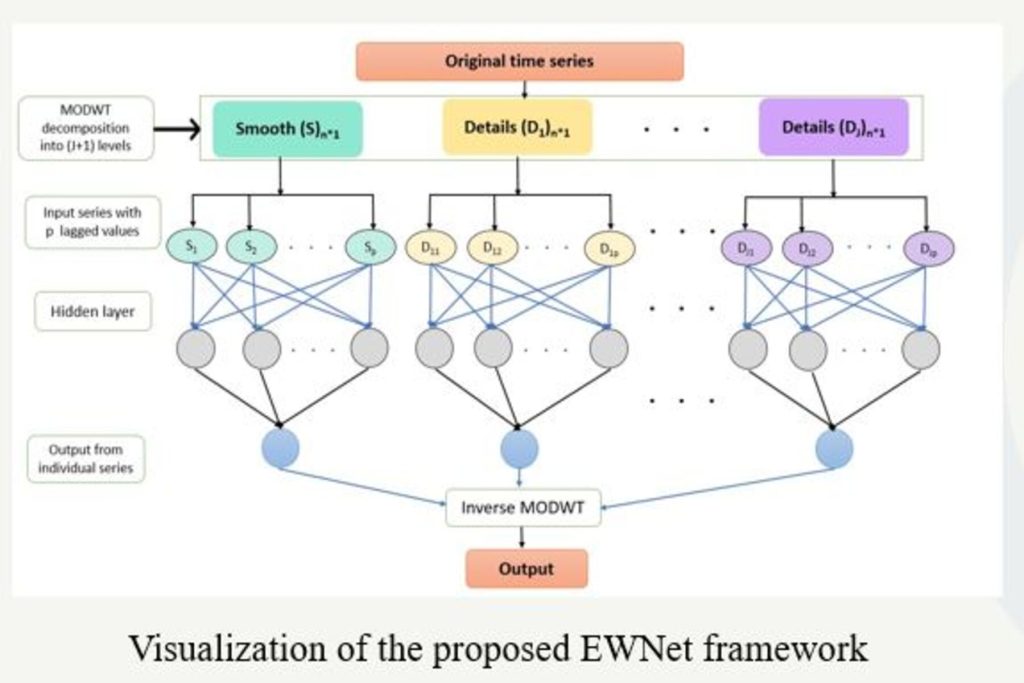
Schematic diagram of the EWNet (Ensemble Wavelet Neural Network) framework: Given the original input series of size n, MODWT (maximal overlap discrete wavelet transform) transformation was employed to decompose the series into one smooth and J detail coefficients each of size n. In the subsequent step, each of the transformed series was modeled with an autoregressive neural network and their forecasts were combined via inverse MODWT transformation to generate the one-step ahead ensemble forecast.
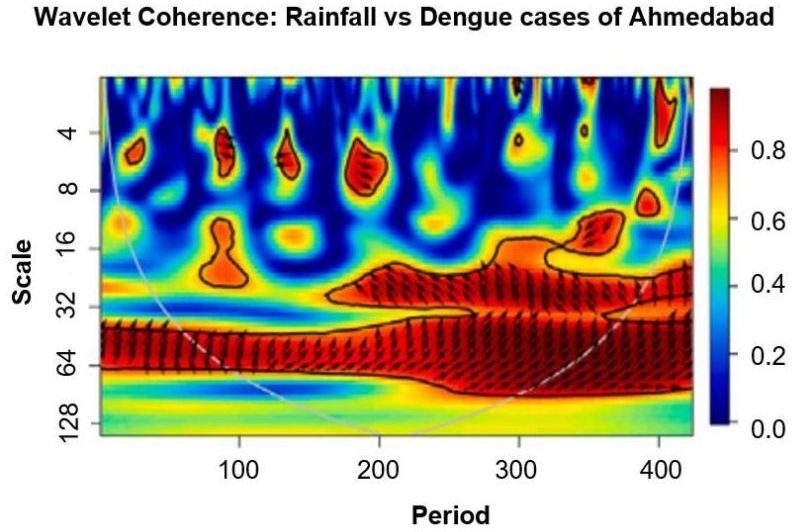
Wavelet coherence plot of Ahmedabad. Colder (blue) to warmer (red) colours indicate an increasingly significant interrelationship between dengue and rainfall. Arrows represent the rection of the relationship, and the cold areas beyond the boundary have no significant relationship. For interpretation of the references to colour in the figure legend, the reader is referred to the web version of the article.
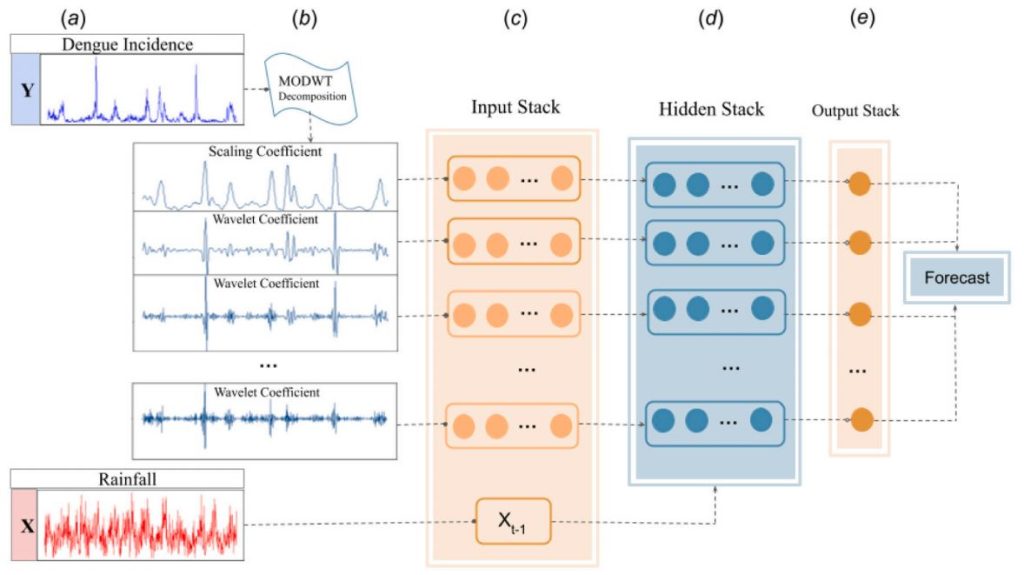
The proposed XEWNet (an ensemble wavelet neural network with exogenous factors) workflow: (a) To predict dengue incidence cases, a weekly time series of dengue cases (Yt) and rainfall (Xt) were provided in the training period, (b) MODWT (maximal overlap discrete wavelet transform) based multi-resolution analysis (MRA) transformation was performed on Y and multiple series of details and smooth coefficients were generated, (c) numerous auto-regressive neural networks (NNs) were trained to individually model the transformed series along with rainfall dataset in the input stack, (d) Each of the NNs were trained with a single hidden layer having a pre-specified number of nodes inside the hidden stack, (e) The output stack comprised of one-step ahead forecast generated by individual NNs. These predictions were combined to generate the final out-of-sample forecast.
t-SNE representation of (a) Imbalanced data distribution (IF = 0.96), (b) Generative Adversarial Minority Oversampling (GAMO) balanced distribution, (c) Deep Synthetic Minority Over-sampling TEchnique (SMOTE) balanced distribution and (d) Structure Preserving Variational Learning (SPVL) balanced distribution.
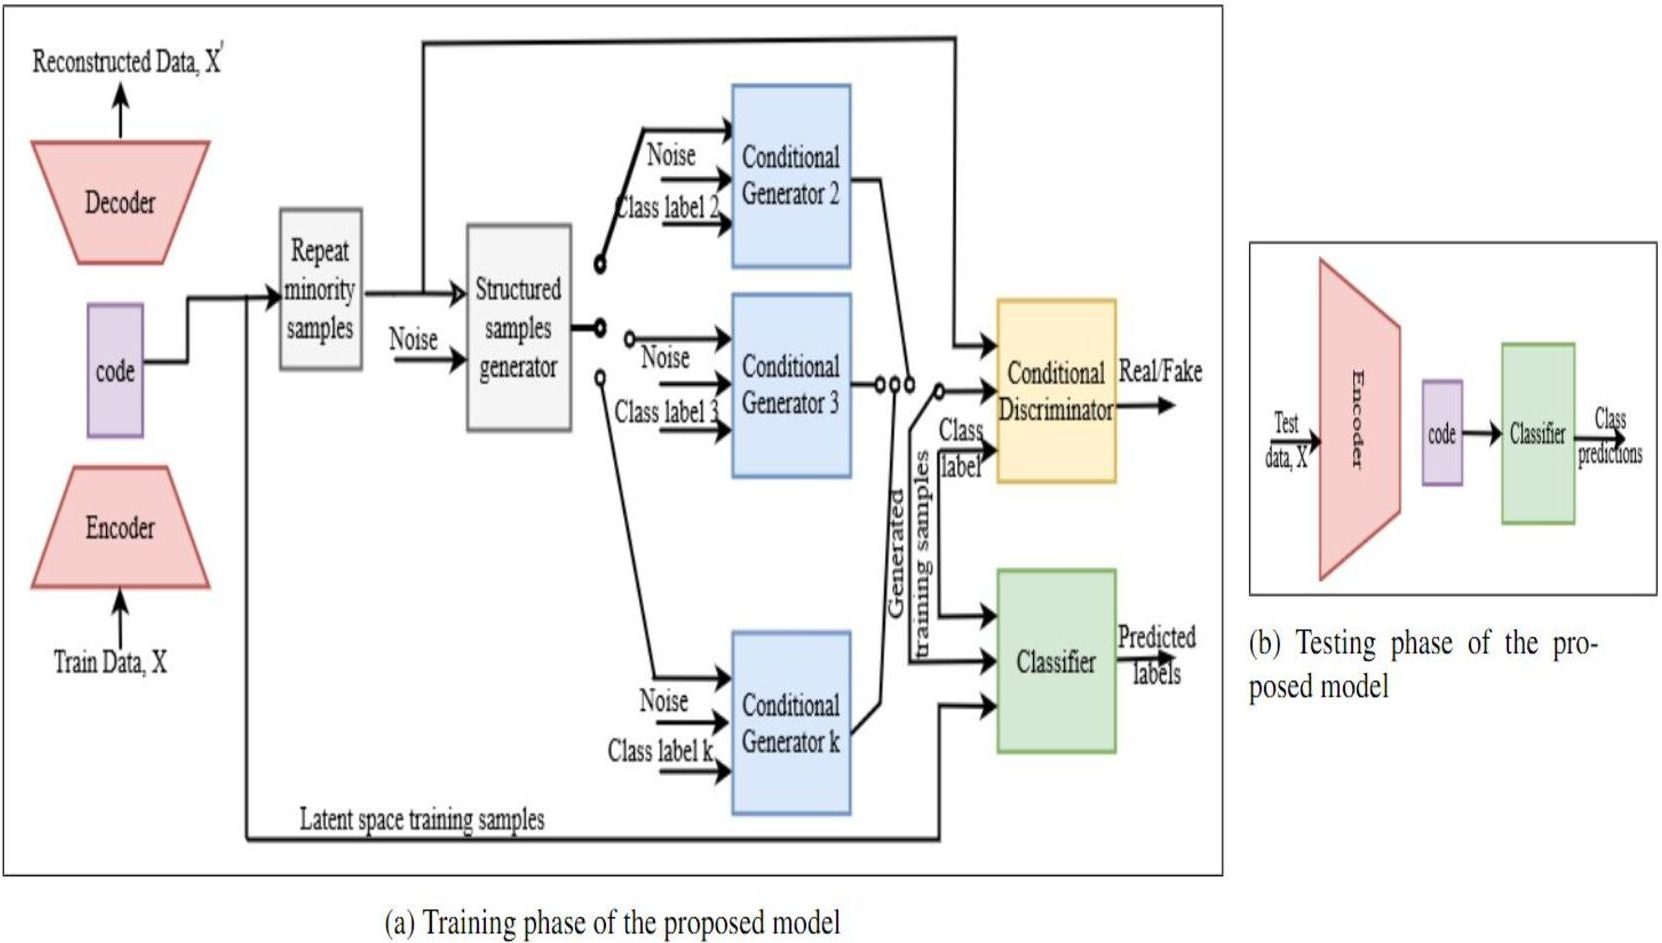
(a) Training phase of SEAL (Structure Enforcing Adversarial Learning). Encoder-decoder framework helps in bringing down the dimensionality of the data and “repeat samples” block is used for stabilizing the GAN training process. “Structured samples generator” block generates samples which preserve the structure of the data. These samples are used for CGAN (conditional GAN) training to compute the structure loss and thus to boost the GAN generator to generate samples which maintain the covariance structure of the minority class training data, (b) shows the testing phase of SEAL.
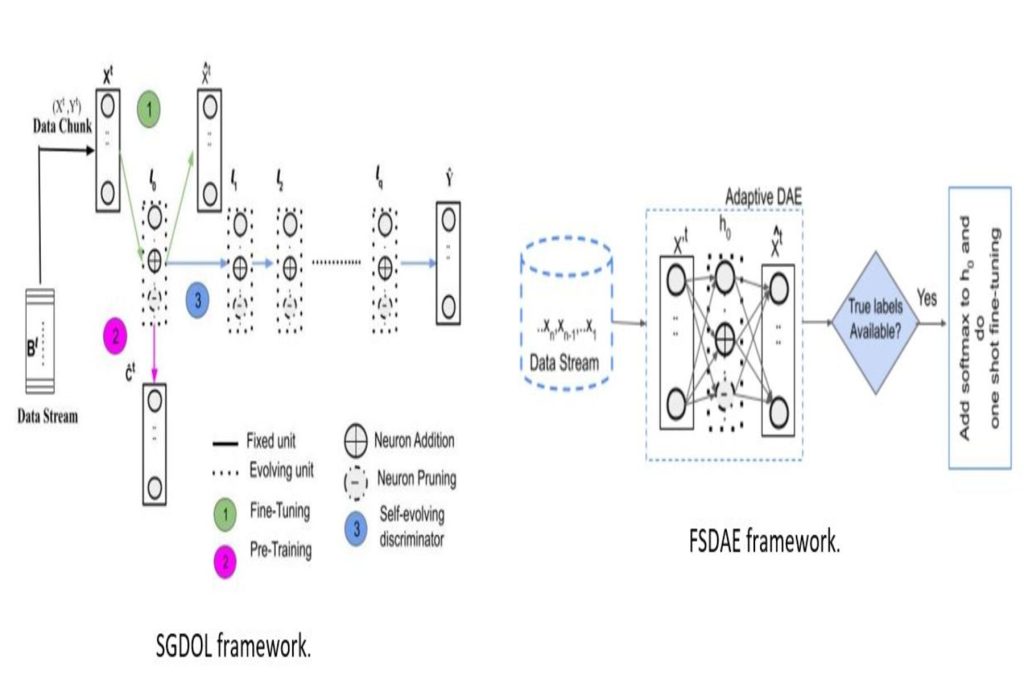
Self-evolving Generative and Discriminative Online Learning (SGDOL) framework. Flexible Self-evolving Generative Denoising Autoencoder Network (FSDAE) learning model.
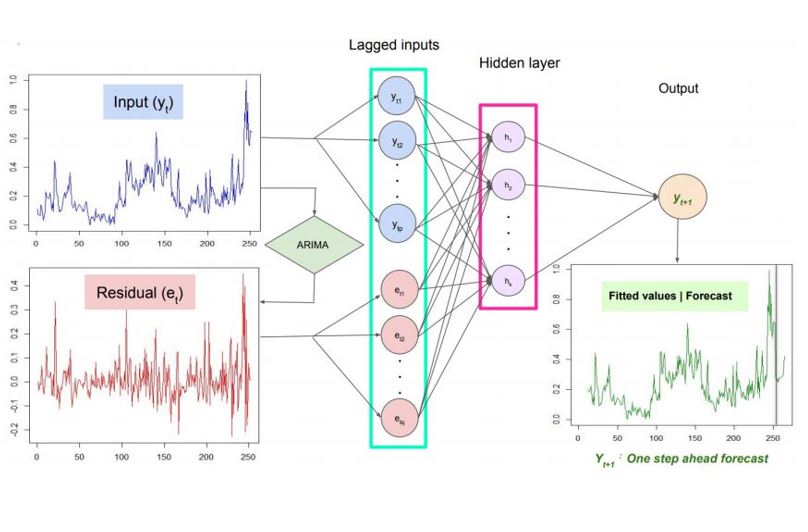
Schematic diagram of proposed Probabilistic AutoRegressive Neural Net-work (PARNN) model, where yt and et denote the original time series and residual series obtained using autoregressive integrated moving average (ARIMA). The value of k in hidden layer is set to k = [(p+q+1)/2].
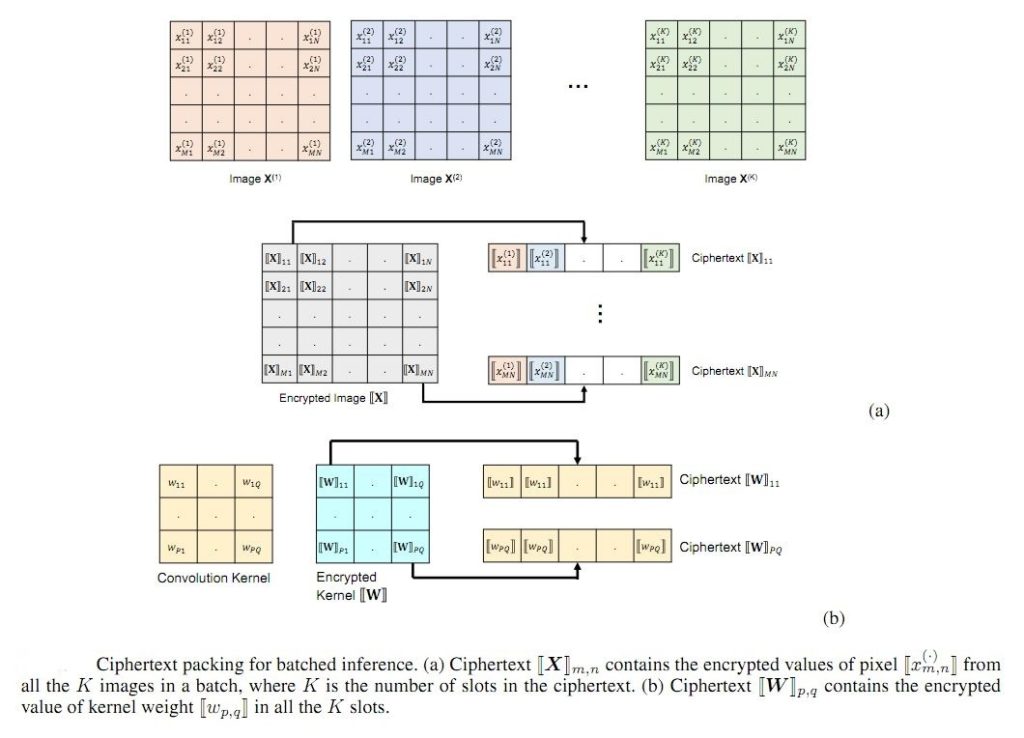
Ciphertext packing for batched inference. (a) Ciphertext [X]m,n contains the encrypted values of pixel [Xm,n] from all the K images in a batch, where K is the number of slots in the ciphertext. (b) Ciphertext [W]p,q contains the encrypted value of kernel weight [Wp,q] in all the K slots.
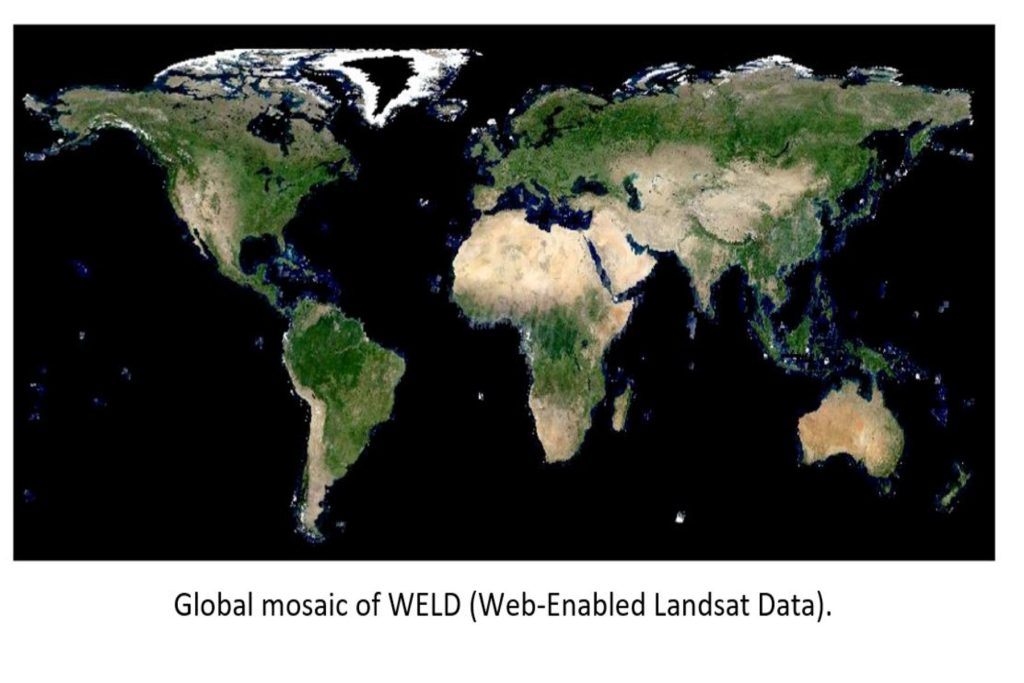
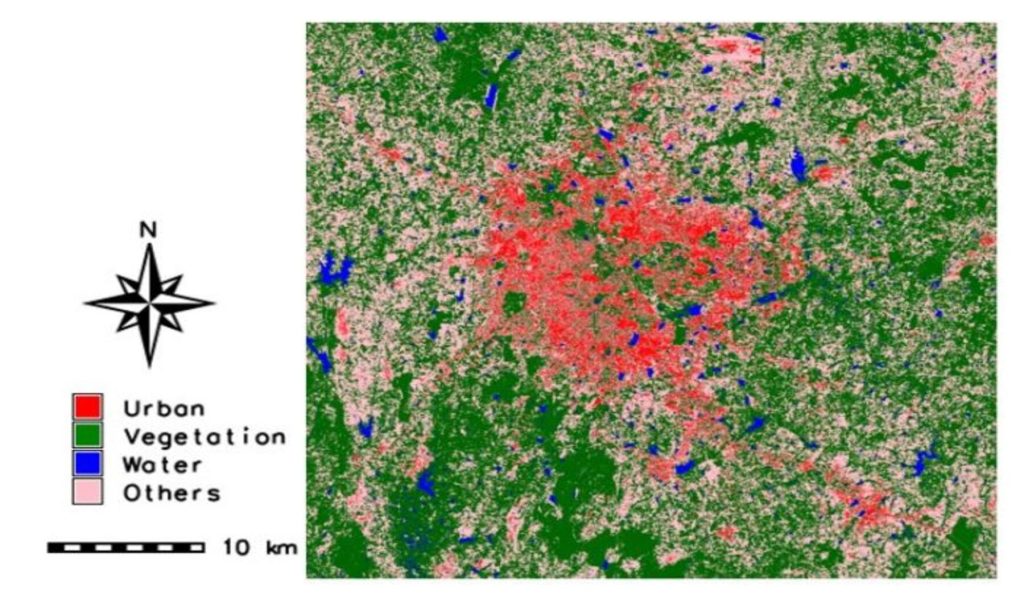
Global mosaic of 8003 scenes generated from the 2011 annual WELD (Web-Enabled Landsat Data). Each scene is composed of 5295 rows and 5295 columns, therefore, a single snapshot of global data consists of 224.3 billion pixels with 6 spectral dimensions (~224.3 x 6 spectral bands)
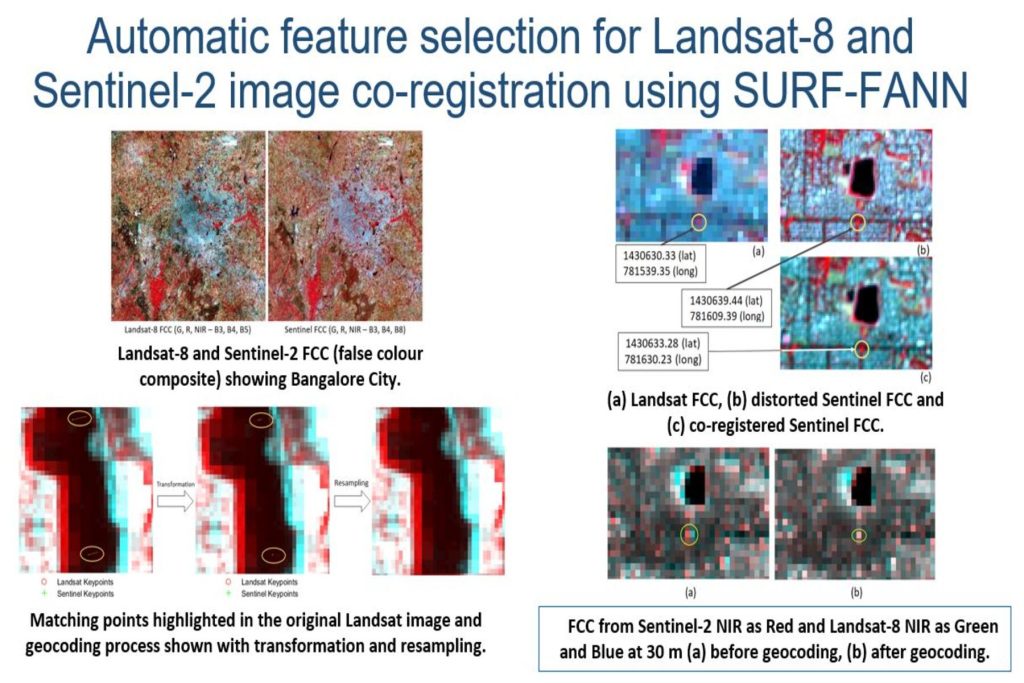
Multi-satellite sensor image to image matching using Speeded-Up Robust Features-Fast Approximate Nearest Neighbour (SURF-FANN).
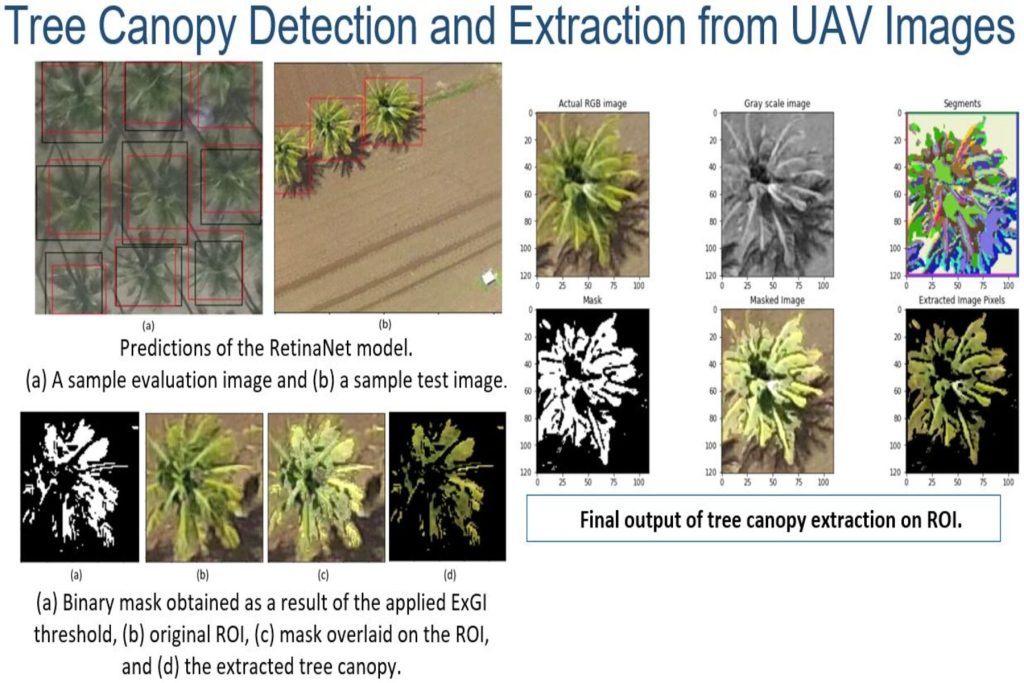
Classification of sample dataset: (a1, a2, a3, a4) show building maps from RF model, (b1, b2, b3, b4) are post-processed building maps by the morphological operation, and (c1, c2, c3, c4) depict the manually digitized ground truth image.
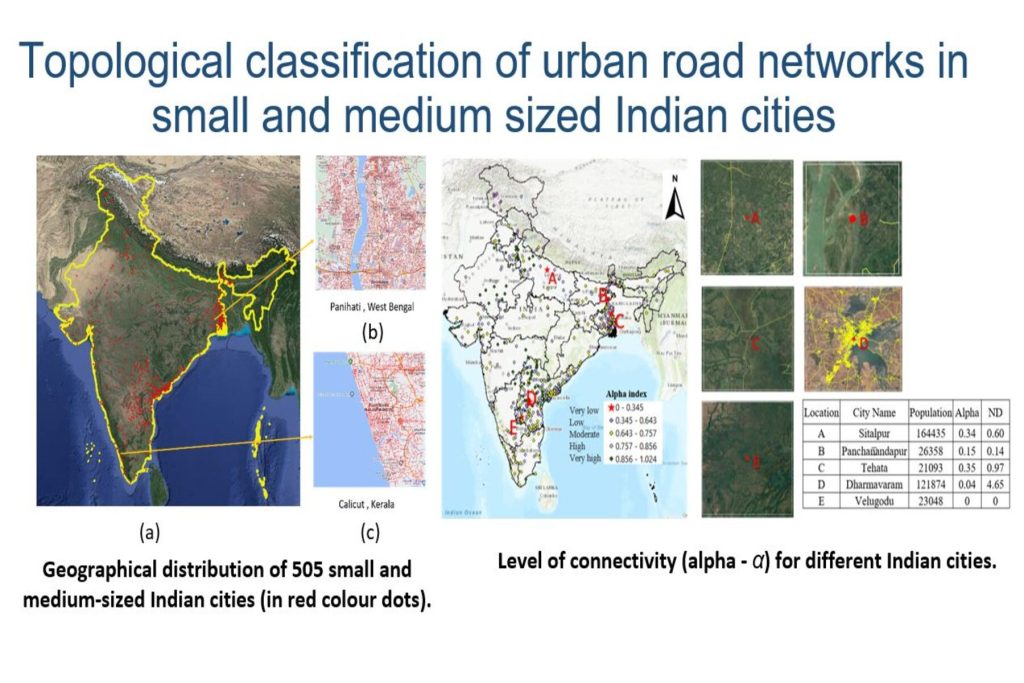
(a) Geographical distribution of 503 small and medium-sized Indian cities included in the study (red colored square grids indicate the selected cities); (b) and (c) are examples of human settlement and transportation maps of two random cities, namely Calicut from the state of Kerala and Panihati from the state of West Bengal.
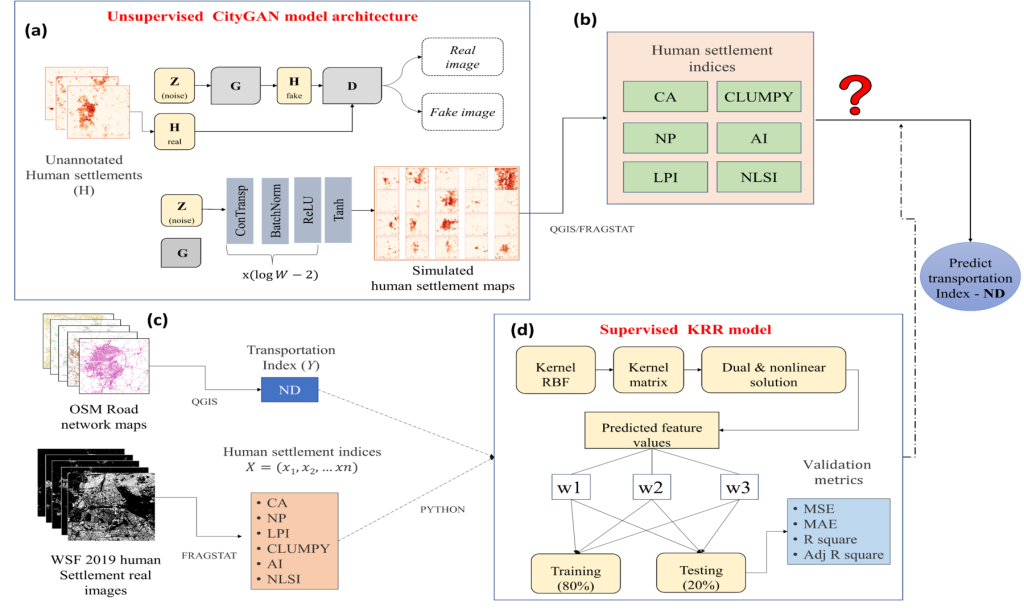
Predicting urban patterns and transportation trends in India's urban system through machine learning approach. Prediction framework of the proposed hybrid RidgeGAN model: (a) Implementing an unsupervised learning model (CityGAN) to generate small and medium-sized Indian cities; (b) Landscape structures of generated cities are measured in terms of human settlement indices (HSI) using spatial landscape metrics; (c) Characteristics of the road network and landscape structures of real cities are measured in terms of HSI and transportation index (TI); (d) Assessing the relations between the settlement patterns and transportation system and building a supervised learning model to predict the transportation index for GAN-generated urban universe.
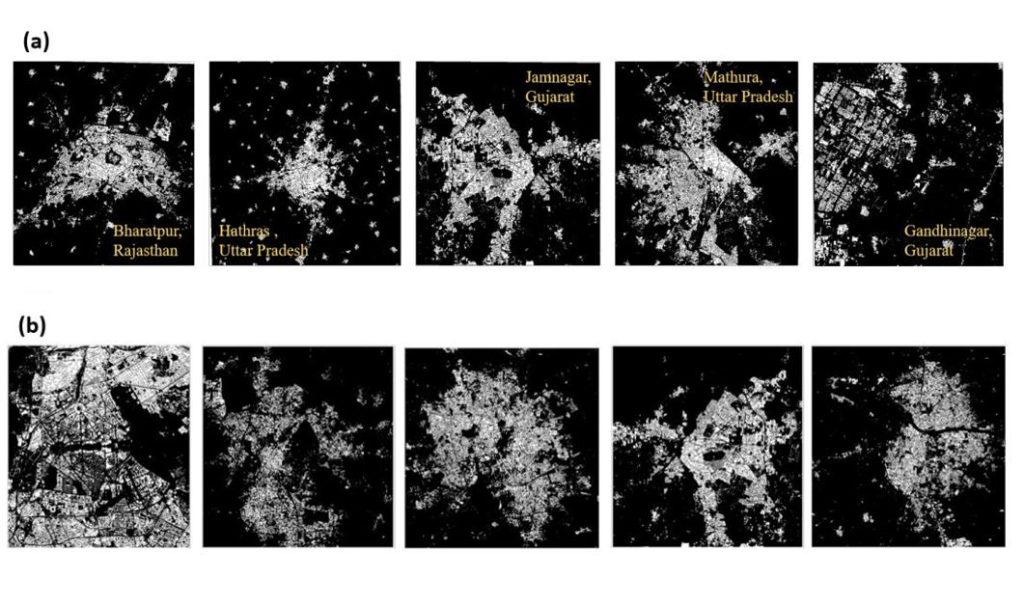
Comparison of real urban built land use maps (a) and synthetic maps (b) generated by a CityGAN. The pixel values in each case are in the range [0, 1], where 1 represents the portion of land occupied by buildings. Names of the cities are reported in (a) using yellow colour text.
Land use prediction through Incremental Online Learning with multiple years of training data using Adaptive Random Forest.
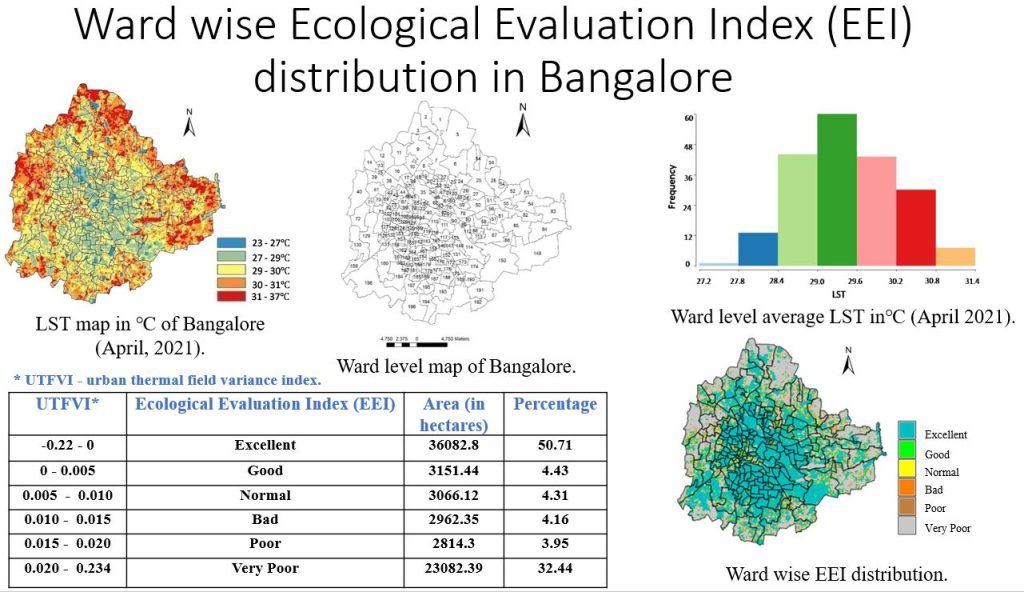
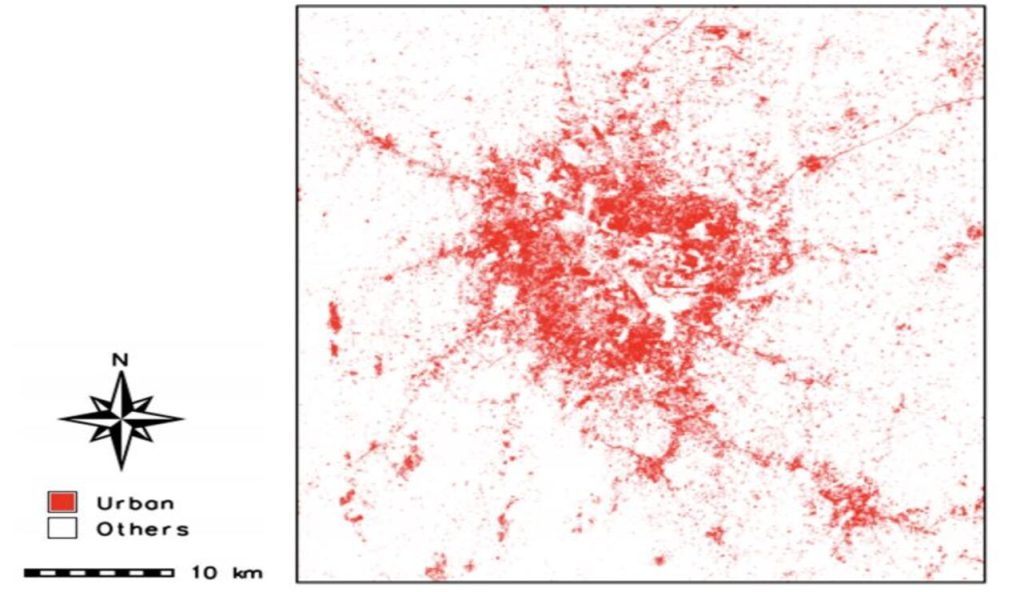
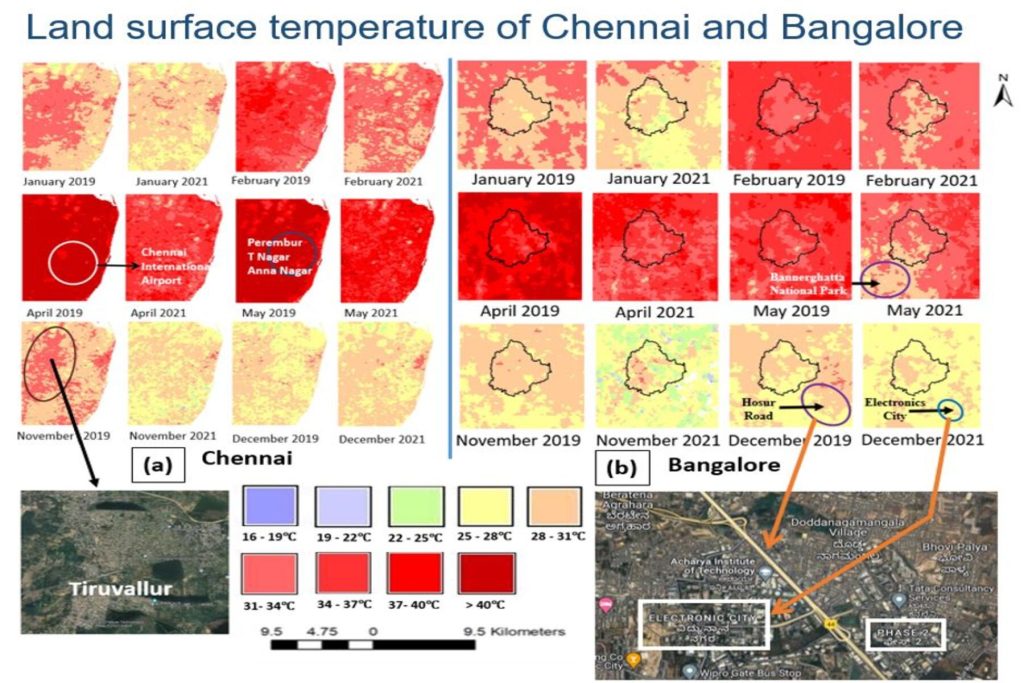
Ecological evaluation, spatial variables and urban heat island in Bangalore, India.
Spatial Modelling with Incremental Learning and Spatio Temporal Matrix.
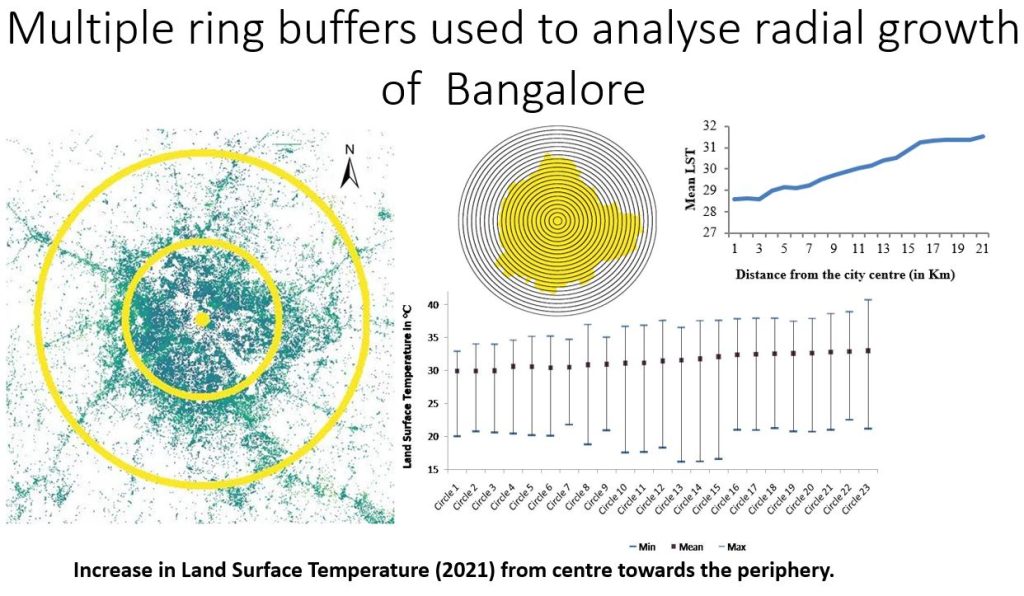
Mean land surface temperature (LST) in concentric ring buffers with 1 km radius from the City center.

We are located at IIIT Bangalore in Electronics City in the Silicon Valley of India. We are also collaborating with Industries, Research Institutions, Government Agencies / Organisations as well as Universities for applied and cutting edge research.


Partners & Sponsors

1_IIITB
2_Infosys_foundation


IIIT Bangalore, 

26/C, 

Opposite Infosys, 

Electronics City Phase 1, 

Hosur Road, 

Bangalore – 560100. India.

loader-image
Bangalore
Bengaluru, IN
10:47 AM, Nov 21, 2024
temperature icon 23°C
mist
Humidity 74 %
Wind 9 Km/h
Clouds Clouds: 40%
Sunrise Sunrise: 6:21 AM
Sunset Sunset: 5:50 PM